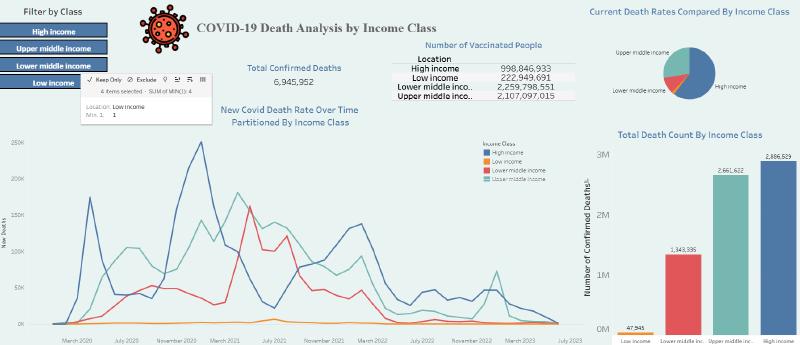
This is an extension of the previous COVID-19 Case Analysis. Diving deeper into the data presented, I used SQL Server Management Studio (SSMS) and Tableau to organize and visualize key data that shows the differences of COVID-19 vaccination and death rates among income classes.
Software used: Microsoft Excel, SQL Server Management Studio (SSMS), Tableau