It’s been a while since I’ve worked on a personal project using Tableau and SQL, but I finally had a chance to dive back in with a dataset that caught my interest: Airbnb listings across New York City’s four major boroughs.
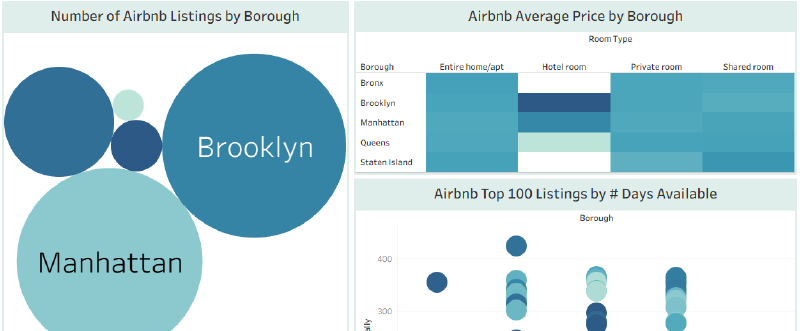
Using SQL to clean and explore the data, I built a Tableau dashboard to visualize key insights, including:
The number of listings per borough
The highest and lowest Airbnb prices by borough
The top 5 and lowest 5 rated listings based on star ratings
It was a great way to practice combining SQL and Tableau while uncovering interesting patterns in NYC’s short-term rental market. I’m excited to share the dashboard and insights from this project, and I look forward to continuing to explore real-world datasets in creative ways.
Software used: SQL, DuckDB, DBeaver, Tableau Desktop